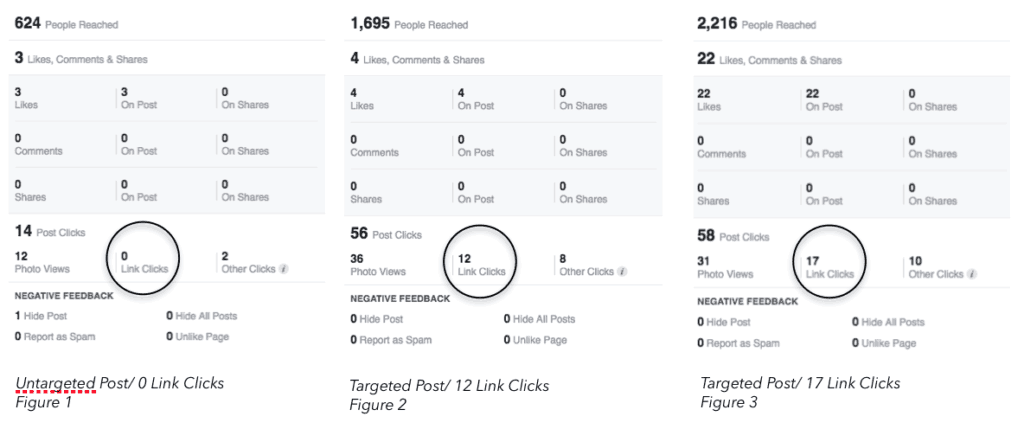
WKH Solutions was tasked with developing a social media campaign to promote Client A’s summer classes. Through targeted boosted posts on Facebook and Instagram, WKH aimed to grab the attention of 13-17 year old students and parents ages 25-50. While speaking with the client during the campaign, we could see that we were able to grab the target audience’s attention through link clicks and engagement (Figure 2 and 3), but the client was not seeing the results in their sign-ups.

Since WKH could see that their strategy was grabbing the attention of the targeted audience, we explored Client A’s Google Analytics to see if the data could tell the story. The results showed that while many people were entering the website onto the summer classes page, not many were engaged enough to learn more. WKH concluded that we needed to look at the summer classes web page more carefully and make recommendations on how to engage the students as well as their parents.
With this information, the creative team was able to make recommendations to the client with the intent of engaging the target audience. After making the changes on May 25th, there were fewer people leaving the page and more people were coming onto the website through social media.

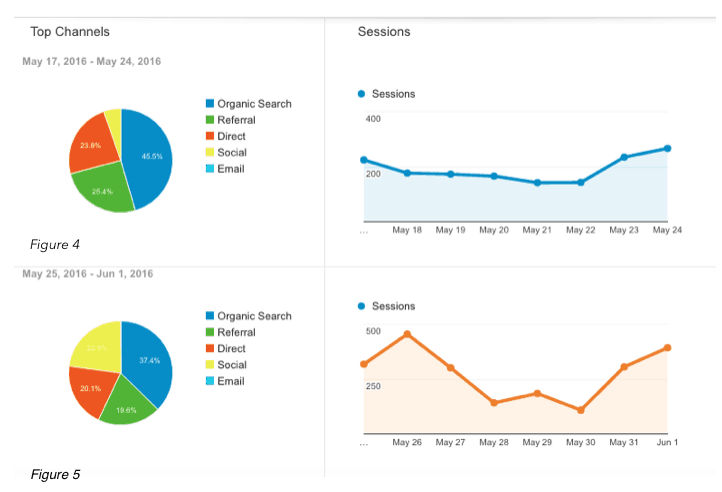
May 17th-May 24th: Total 5.3% engaging on social media with an average of 200 sessions per day (Figure 4)
May 25th- June 1st: Total 22.9% engaging on social media with an average of 290 sessions per day (Figure 5)
After the changes, there was a significant increase in sessions as well as more people entering the website through social media. (Figure 4 and 5)
While there were less individuals coming to the classes landing page, the data shows us that there was a huge drop in the bounce rate (44.56% to 28.57%) as well as the percentage of people who exited the page (27.47% to 23.69%) from the week of May 17-May 24 compared to May 25-June 1 (Figure 6).
Bounce Rate: the percentage of single-page visits (visits in which a person left your site from the entrance page without interacting with the page)
Percent exit: (number of exits/ number of page views). It indicates how often users exit from that page or set of pages when they view the page(s)

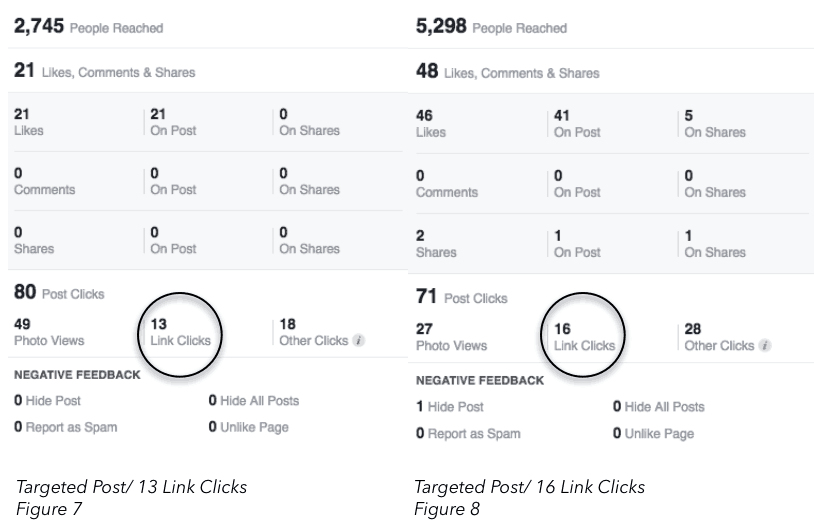
After the website changes, there was a steady increase in sign-ups and the classes filled. Throughout the rest of the campaign, WKH continued to maintain the attention of the targeted audience like they had in the beginning of the campaign through engaging photos and exciting opportunities (Figure 7 and 8).


